Crunching 2024's final Top Fuel stats
Compared to stick and ball sports, motorsports stats have traditionally been very limited due to the nature of competition. For years, drag racing statskeepers would track wins and losses and average time, elapsed time, and speed averages, but that was about it. Drag racing simply had no stats like "how left-handed batters fared against guys named Jim on Tuesdays in August when the temperature was 65 degrees."
But for the last several years, Pete Richards and the NHRA Nitro Research Dept. have been meticulously recording and organizing a vast array of stats that help better tell the story of a racer’s season or even help us better understand how the results of classes as a whole play out and allow us to track various trends. His season-ending report spanned a whopping 191 pages and covered some pretty great stats that we and the NHRA on FOX team use on a regular basis to add some depth and detail to our reporting. You've already seen some of them in stories that Brian Lohnes and I have been doing this offseason (like this one).
Here's the first of four reviews of the final 2024 stats in the Pro classes, focusing on a few of the vital stats that help explain how the year went.
AVERAGE REACTION TIME
Ever since reaction times became an official NHRA stat in 1981, it has been one of the most interesting yet frustrating stat to track. Drivers either love 'em or loathe 'em for what they show/don't show, while crew chiefs seem to largely dislike them, especially when their driver tries to pad their stats because reaction time is affected by many factors, including (but not limited to) how deeply the driver rolls into the staging beams, the individual track's rollout length, and the car's tune-up.
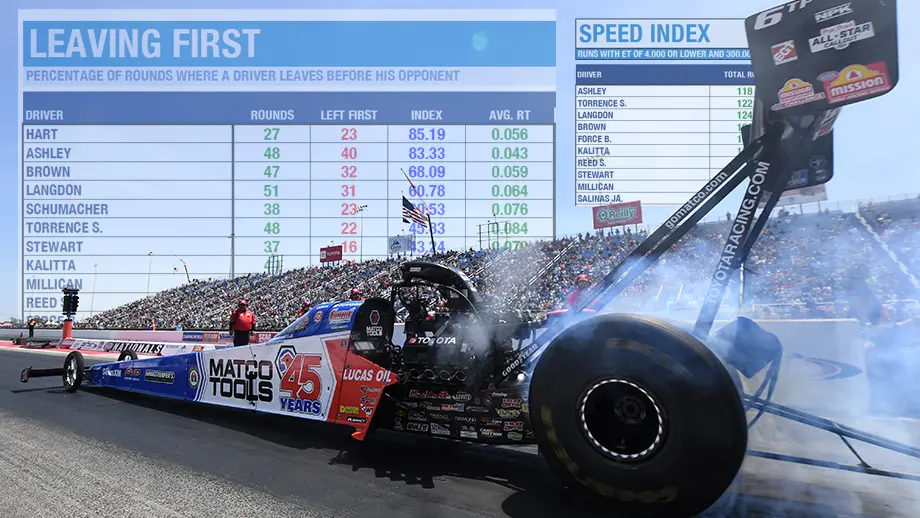
LEAVING FIRST
Regardless of your reaction time, a driver's job, at minimum, is to leave ahead of his or her opponent. Of course, the greater the advantage, the better your chances of winning, but it all starts with that initial move. This stat pack also includes holeshot wins and losses and red-light starts.
SPEED INDEX
This is a measure of runs completed in both qualifying and eliminations, under full or near-full throttle. For Top Fuel, that's runs quicker than 4.000 and faster than 300 mph. This is a measure of crew chief success.
TOP FUEL: REACTION-TIME AVERAGE LEADERS
| DRIVER | LEAVES | AVG. |
Justin Ashley |
48 |
.043 |
Josh Hart |
27 |
.056 |
Antron Brown |
47 |
.059 |
Shawn Langdon |
51 |
.064 |
Tony Stewart |
37 |
.070 |
Clay Millican |
45 |
.075 |
Doug Kalitta |
49 |
.075 |
Tony Schumacher |
38 |
.076 |
Brittany Force |
37 |
.079 |
Steve Torrence |
48 |
.094 |
Shawn Reed |
21 |
.085 |
Billy Torrence |
33 |
.090 |
Observations: No great surprise here as the top four have been the starting-line gunslingers the past several seasons, but Justin Ashley had more than a hundredth on Josh Hart and two-hundredths on Shawn Langdon, which is a lot in this game. Tony Stewart is a bit of a pleasant surprise as the fifth-best leaver — not bad in his rookie season — and Brittany Force has obviously worked hard to improve her numbers.
TOP FUEL: LEAVING FIRST LEADERS
| DRIVER | ROUNDS | LEFT FIRST | % | HS WIN | HS LOSS | FOULS |
Hart |
27 |
23 |
85.19 |
1 |
0 |
2 |
Ashley |
48 |
40 |
83.33 |
9 |
1 |
0 |
Brown |
47 |
32 |
68.09 |
1 |
0 |
0 |
Langdon |
51 |
31 |
60.78 |
5 |
0 |
0 |
Schumacher |
38 |
23 |
60.53 |
2 |
2 |
0 |
Torrence, S |
48 |
22 |
45.83 |
2 |
6 |
0 |
Stewart |
37 |
16 |
43.24 |
0 |
2 |
0 |
Kalitta |
49 |
21 |
42.86 |
2 |
1 |
0 |
Millican |
45 |
19 |
42.22 |
3 |
4 |
0 |
Reed |
25 |
9 |
36.00 |
1 |
3 |
0 |
Force |
37 |
12 |
32.43 |
1 |
2 |
0 |
Torrence, B |
33 |
10 |
30.30 |
1 |
1 |
0 |
Observations: While Hart wins this stat, which means that he's accomplishing every driver's first goal (leaving on your opponent), he's also the only one to red-light, and did it twice, as he attempted to help a car that wasn't at its best (see Speed Index below). Ashley did just the opposite as he was able to help his team win NINE times with a slower pass, and it's stunning to see how much better the duo was than everyone else. Langdon's five holeshot wins are also tremendous, while Steve Torrence assuredly hated letting down "them Capco boys" a half-dozen times.
TOP FUEL: SPEED INDEX
| DRIVER | TOTAL RUNS | WOT | % |
Ashley |
118 |
81 |
68.64 |
Torrence, S |
122 |
81 |
66.39 |
Langdon |
124 |
82 |
66.13 |
Brown |
120 |
79 |
65.83 |
Force |
107 |
68 |
63.55 |
Kalitta |
121 |
75 |
61.98 |
Reed |
98 |
60 |
61.22 |
Stewart |
109 |
66 |
60.55 |
Millican |
115 |
65 |
56.52 |
Salinas, J |
86 |
48 |
55.81 |
Hart |
99 |
53 |
53.54 |
Torrence, B |
107 |
56 |
52.34 |
Observations: At first glance, completing just a shade over two-thirds of your runs under power might seem like a bad thing, but only three teams were able to do that. The stats here are pretty close through the top four, but as we know, it can take only one more successful pass than the other team to win a championship. The Speed Index shows where reaction-time frontrunner Hart's effort's came apart, and Schumacher is not even among the top 12 (he was 13th).
Combo rankings
And below is a combo table that includes the ranking results of the three categories (Reaction Time, Left First, and Wide-Open Throttle runs) above while also factoring in average race-day eliminations e.t. for the season's top 12 finishers. It's organized by order of finish, starting with champ Antron Brown.
| DRIVER | AVG. RT | LEFT 1ST | WOT | AVG. E.T. |
Antron Brown |
3 |
3 |
4 |
4 |
Doug Kalitta |
7 |
8 |
6 |
5 |
Justin Ashley |
1 |
2 |
1 |
7 |
Shawn Langdon |
4 |
4 |
3 |
1 |
Brittany Force |
9 |
11 |
5 |
12 |
Clay Millican |
6 |
9 |
9 |
2 |
Steve Torrence |
10 |
6 |
2 |
6 |
Tony Schumacher |
8 |
5 |
13 |
3 |
Tony Stewart |
5 |
7 |
8 |
11 |
Shawn Reed |
11 |
10 |
7 |
8 |
Billy Torrence |
12 |
12 |
12 |
10 |
Josh Hart |
2 |
1 |
11 |
9 |
Observations: While world champ Brown didn't lead in any stats category, he was top four in all four (and third in three of them), making for an impressive overall package. You can also plainly see Ashley's downfall here being average race-day eliminations. He's first or second in the first three but just seventh in the last one. Langdon, like Brown, didn't have a weak spot and probably deserved better than a fourth-place finish, but won just one round in the points-and-a-half events (indy and the Finals).
And, finally, here are the season leaders for several other key performance stats:
| NO. 1 QUALIFIERS | |
Force |
6 |
Kalitta |
5 |
Torrence, S |
3 |
Langdon |
2 |
Zizzo |
2 |
| LOW E.T. OF EVENT | |
Kalitta |
10 |
Force |
6 |
Five tied |
1 |
| TOP SPEED OF EVENT | |
Kalitta |
7 |
Force |
7 |
Torrence, S |
3 |
Millican |
2 |
Torrence, B |
1 |
| QUICKEST REACTION TIME OF EVENT | |
Ashley |
14 |
Hart |
3 |
Stewart |
1 |
Millican |
1 |
Pritchett, G |
1 |
| HOLESHOT WINS (season) | |
Ashley |
9 |
Langdon |
5 |
Millican |
3 |
Kalitta |
2 |
Schumacher |
2 |
Torrence, S |
2 |
Next up: Funny Car
